CemGEMS gallery: OPC
Ordinary Portland Cement (OPC) hydration
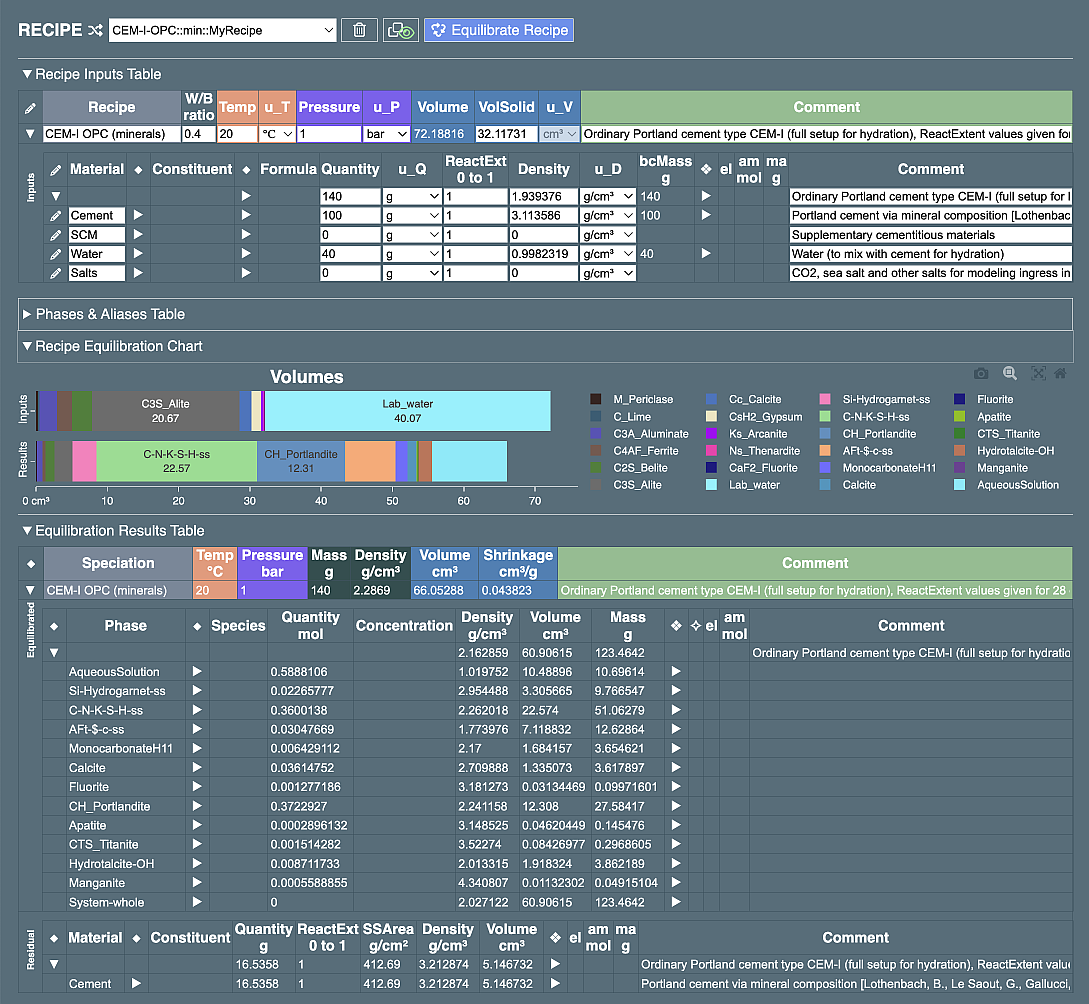
Tree-like recipe tables and bar charts showing initial and equilibrated (28 days) volumes for OPC cement
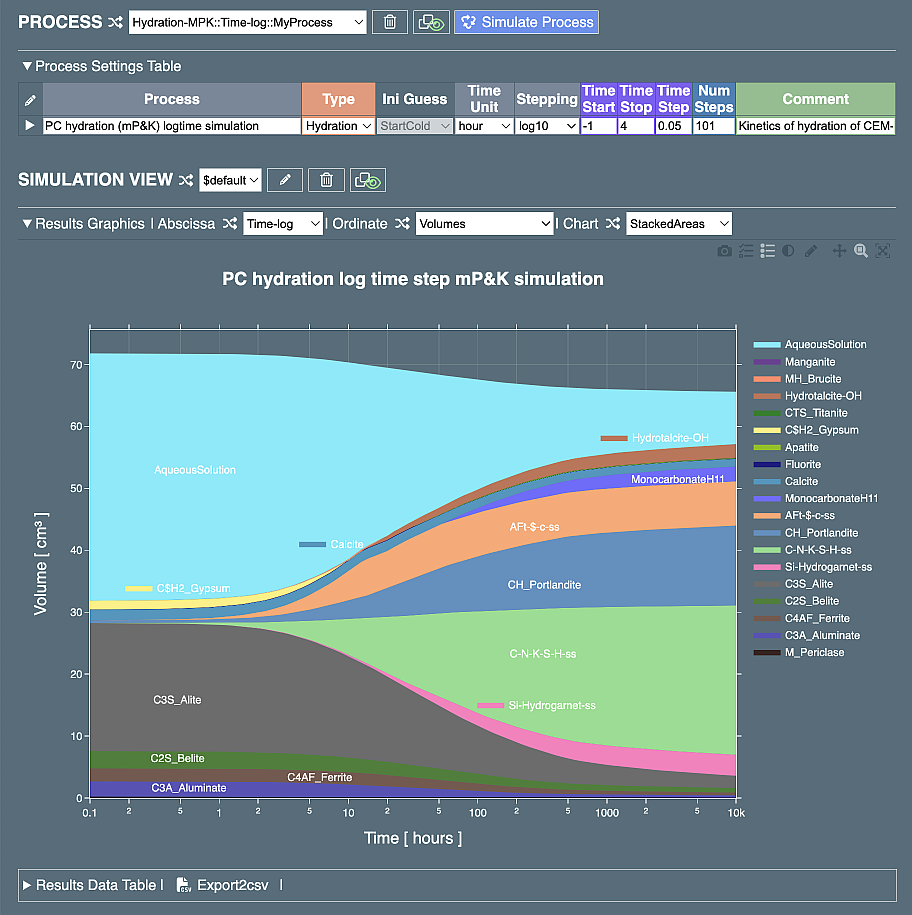
Stacked areas chart showing volumes of solids upon OPC hydration process during 10'000 hours (417 days)
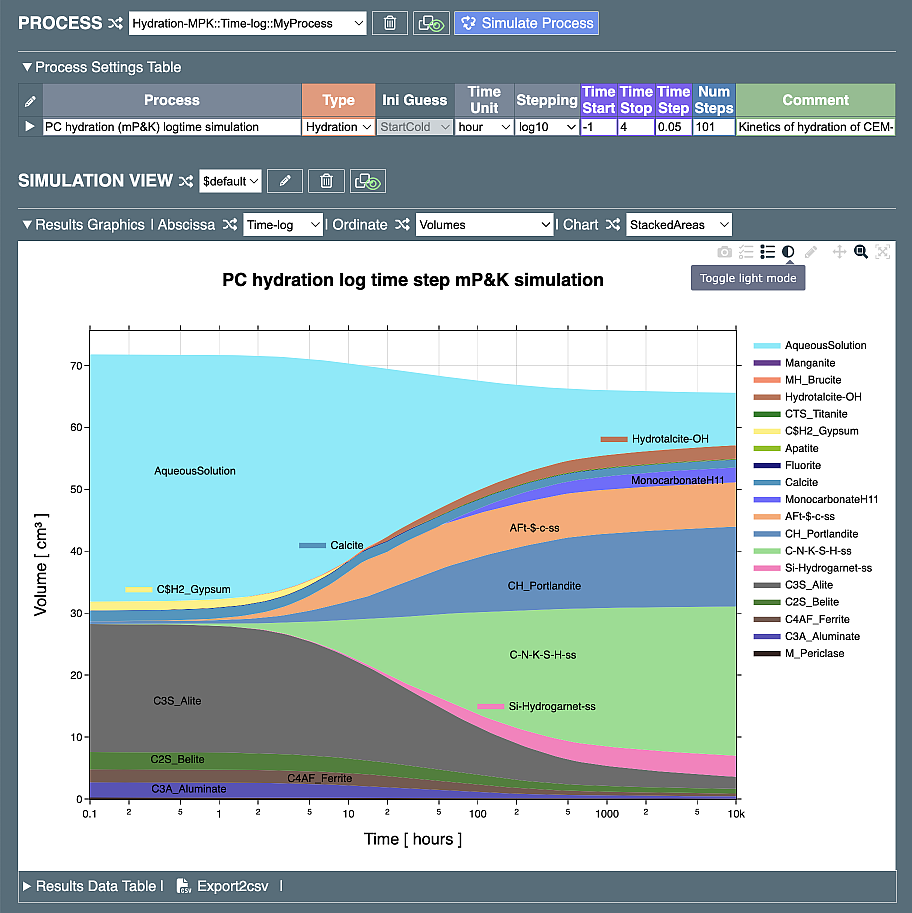
Stacked areas chart (volumes of solids upon OPC hydration process during 417 days) in "daylight" mode
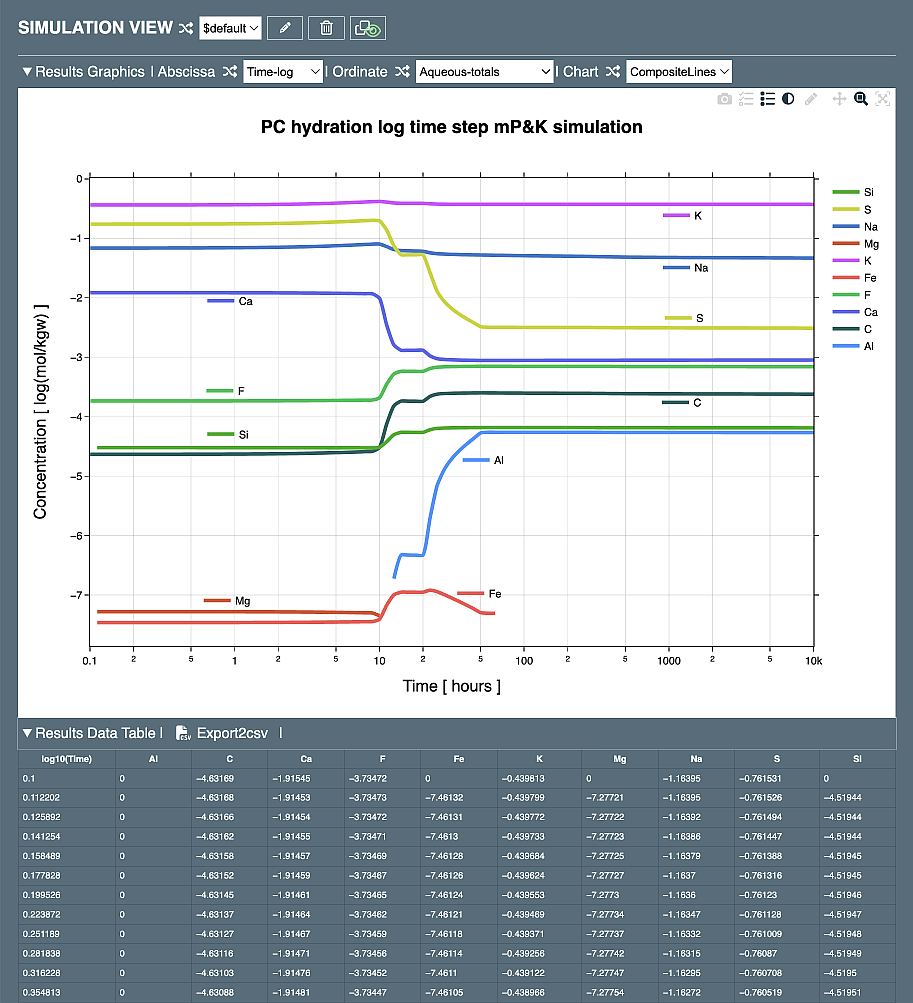
Composite lines chart showing dissolved concentrations of chemical elements in pore water upon OPC hydration, with a data table fragment
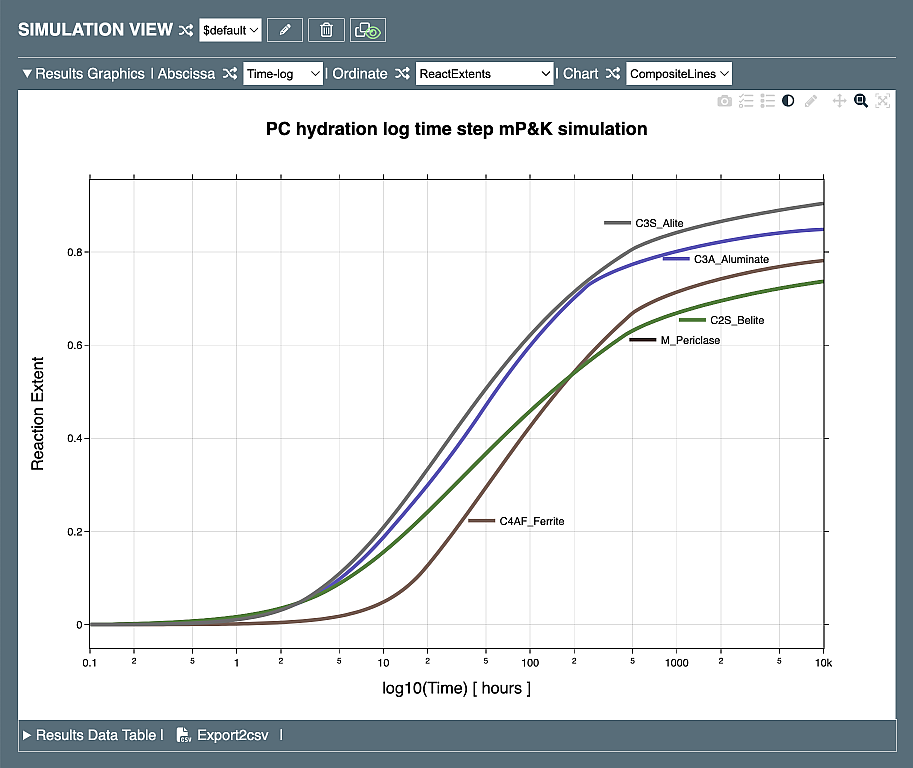
Composite lines chart showing degrees of reaction of OPC constituents upon OPC hydration process
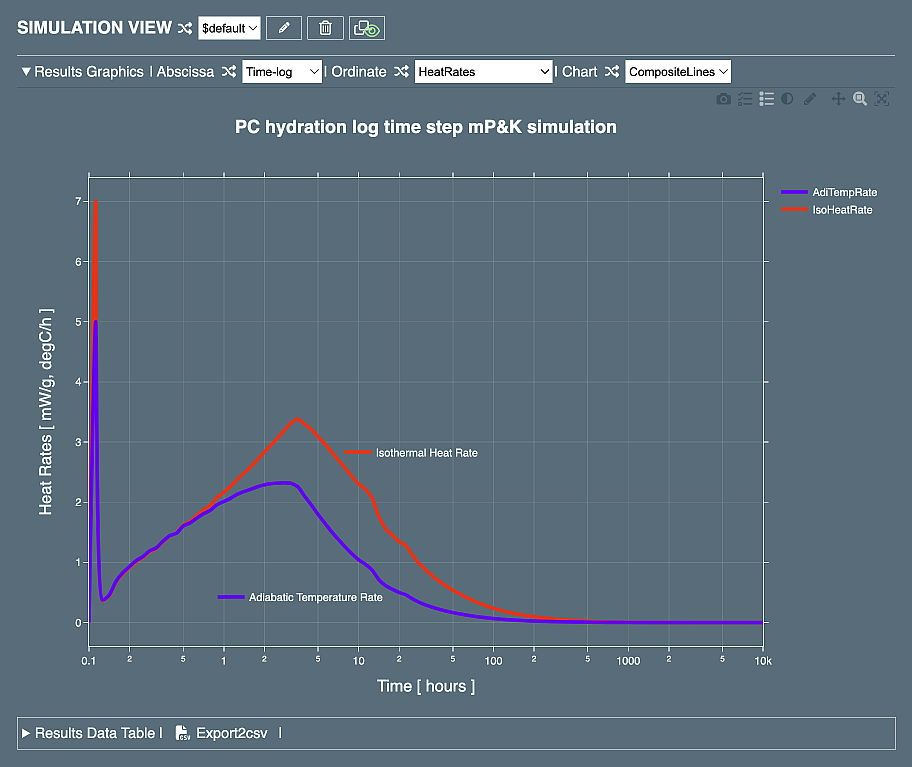
Composite lines chart showing rates of isothermal heat generation and estimated adiabatic temperature change upon OPC hydration process
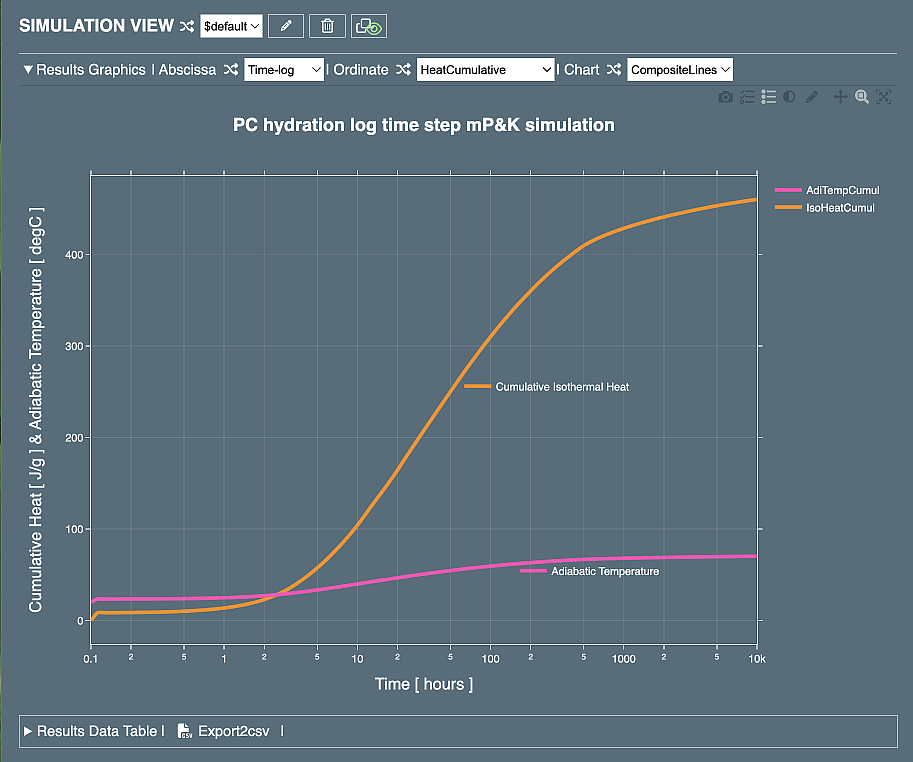
Composite lines chart showing isothermal cumulative heat and estimated adiabatic temperature rise upon OPC hydration process
Disclaimer!
The above screen images may differ from those displayed for the same recipe and processes by the web app version which is currently online. This is due to persistent constant improvement and bugfixing of CemGEMS, see ChangeLog.