CemGEMS user guide
Plots: Customization and export
Starting from release v.0.8.0, CemGEMS provides a new graphics module that produces high-quality 1-D horizozntal bar charts for equilibrated recipes and 2-D plots for process simulation results shown as composite line, composite area or bar-chart plots. Both 1-D and 2-D plots can be viewed in 'light' or 'dark' modes, zoomed and panned, and exported into local image files (2-D plots can be exported in bitmap or vector graphic files as well as JSON strings).
2-D plots now offer an edit mode allowing to customize plot title, axis titles, and any legend entry text. The whole main legend can be hidden or shown, some entries can be disabled if necessary; each legend item can be moved around the plot area and positioned where appropriate. Any line or area can be hidden from the plot by toggle-clicking on the respective legend entry. More plot editing functionality will be added in future. All plot customizations are automatically saved in a database Plot document and will persist at least until the Process is re-simulated.
Attention!
The best workflow for obtaining good plots for your reports or publications consists in checking the process simulation results, if necessary, modifying the process definition and/or the recipe until you are satisfied with the result as such, and the only remaining step is to produce and export a nice, publication-quality graphics. Only then it makes sense to do all the customizations and to export the plots into graphic files. The chance of not losing the work and the time spent on plot customizations will be the highest because there will be no need to re-define and re-calculate the recipe and/or process. New calculations can be always done by cloning the new recipe or process object.
1-D Horizontal bar plots for cement recipes
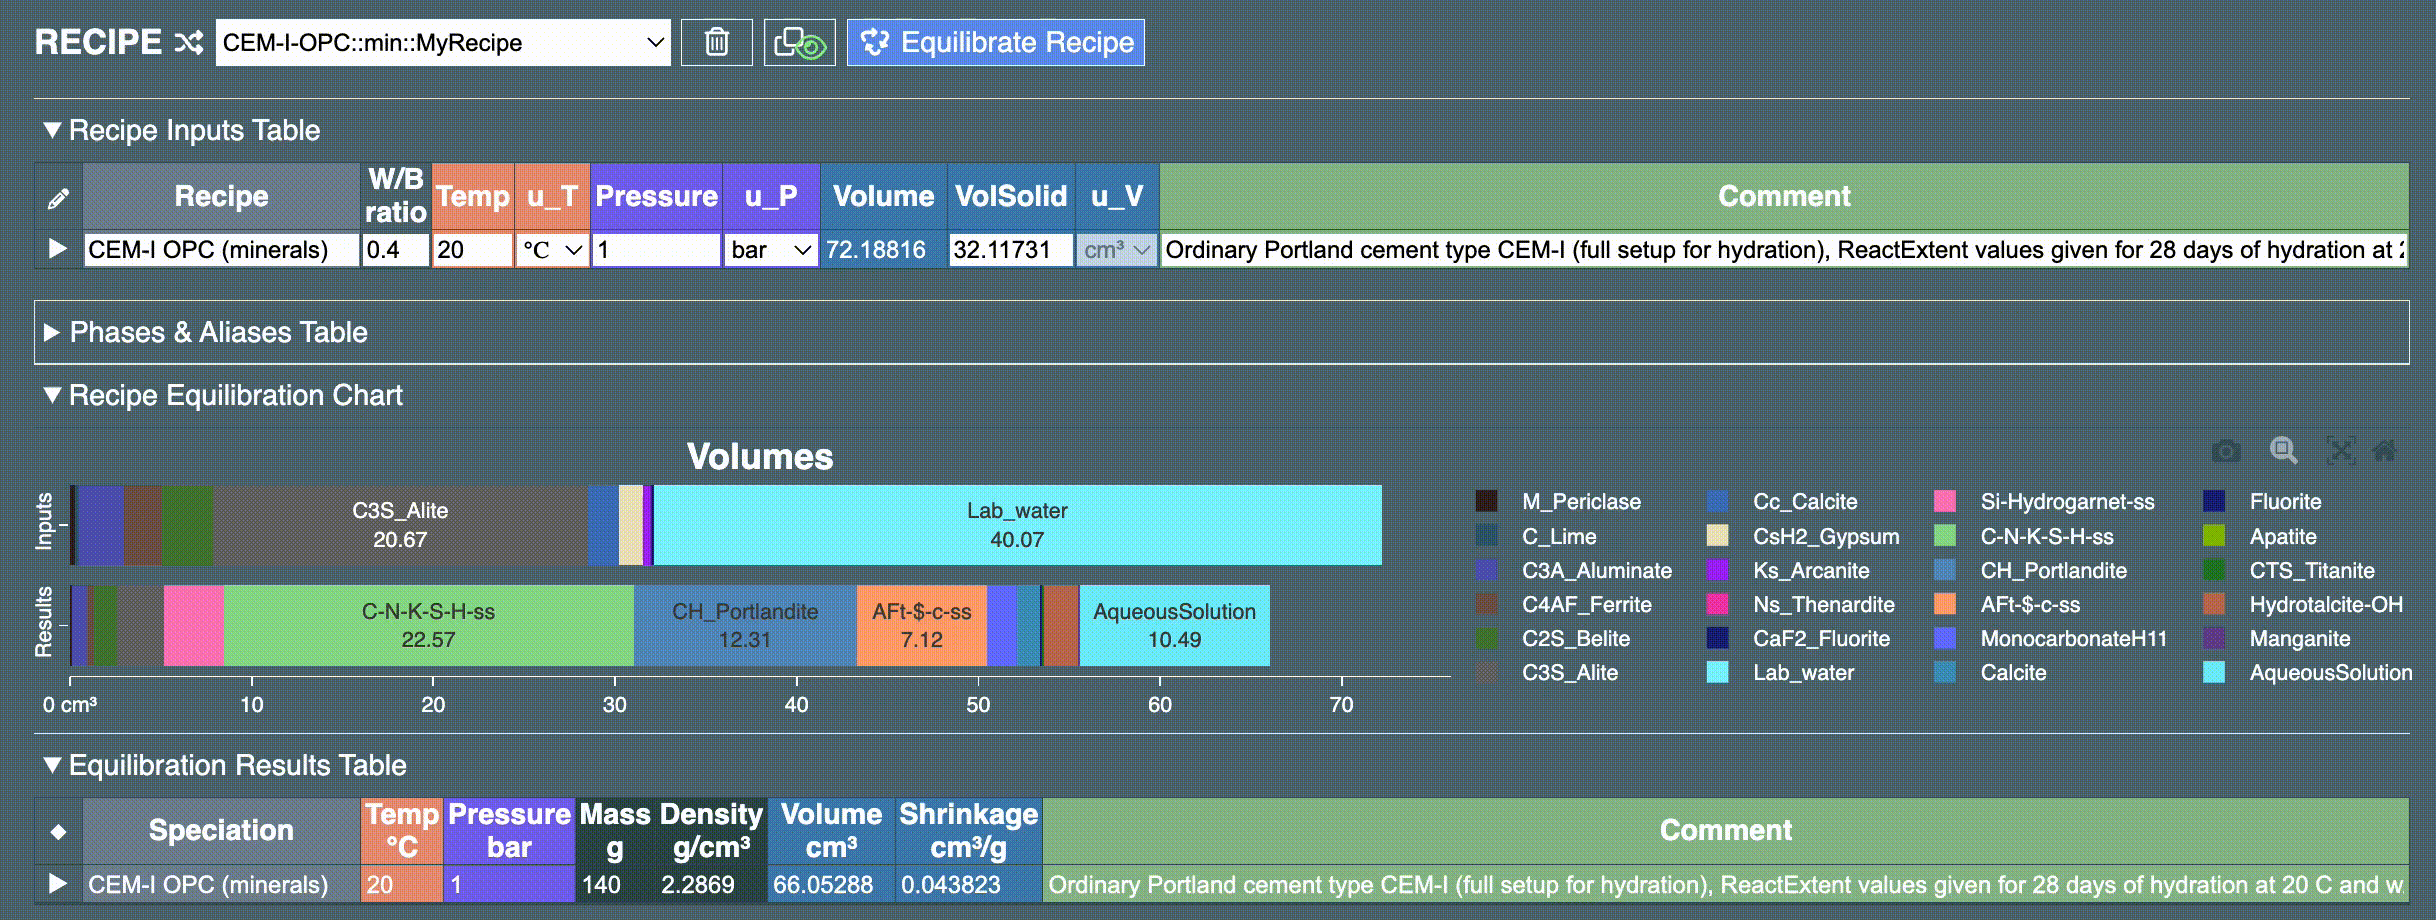
The short (ca 1 min) screencast below shows a simple navigation over the plot showing initial and final (equilibrated) phases and constituents of the current cement recipe.
 To re-run the screencast, please reload this page.
In the main legend, toggling by mouse click on a phase/constituent item hides and displays the respective bar(s) on the chart. Dragging the cursor over the area on the chart zooms along the horizontal axis (zooming into a zoomed area is also possible). Clicking on the "Autoscale" menu button restores the original axis scale.
Clicking on the "Download plot ..." button saves the image as a .png file in your local 'Downloads' folder. Example of the downloaded image is given below. 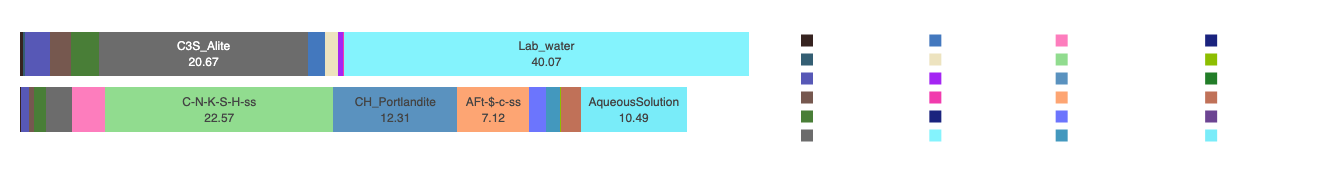
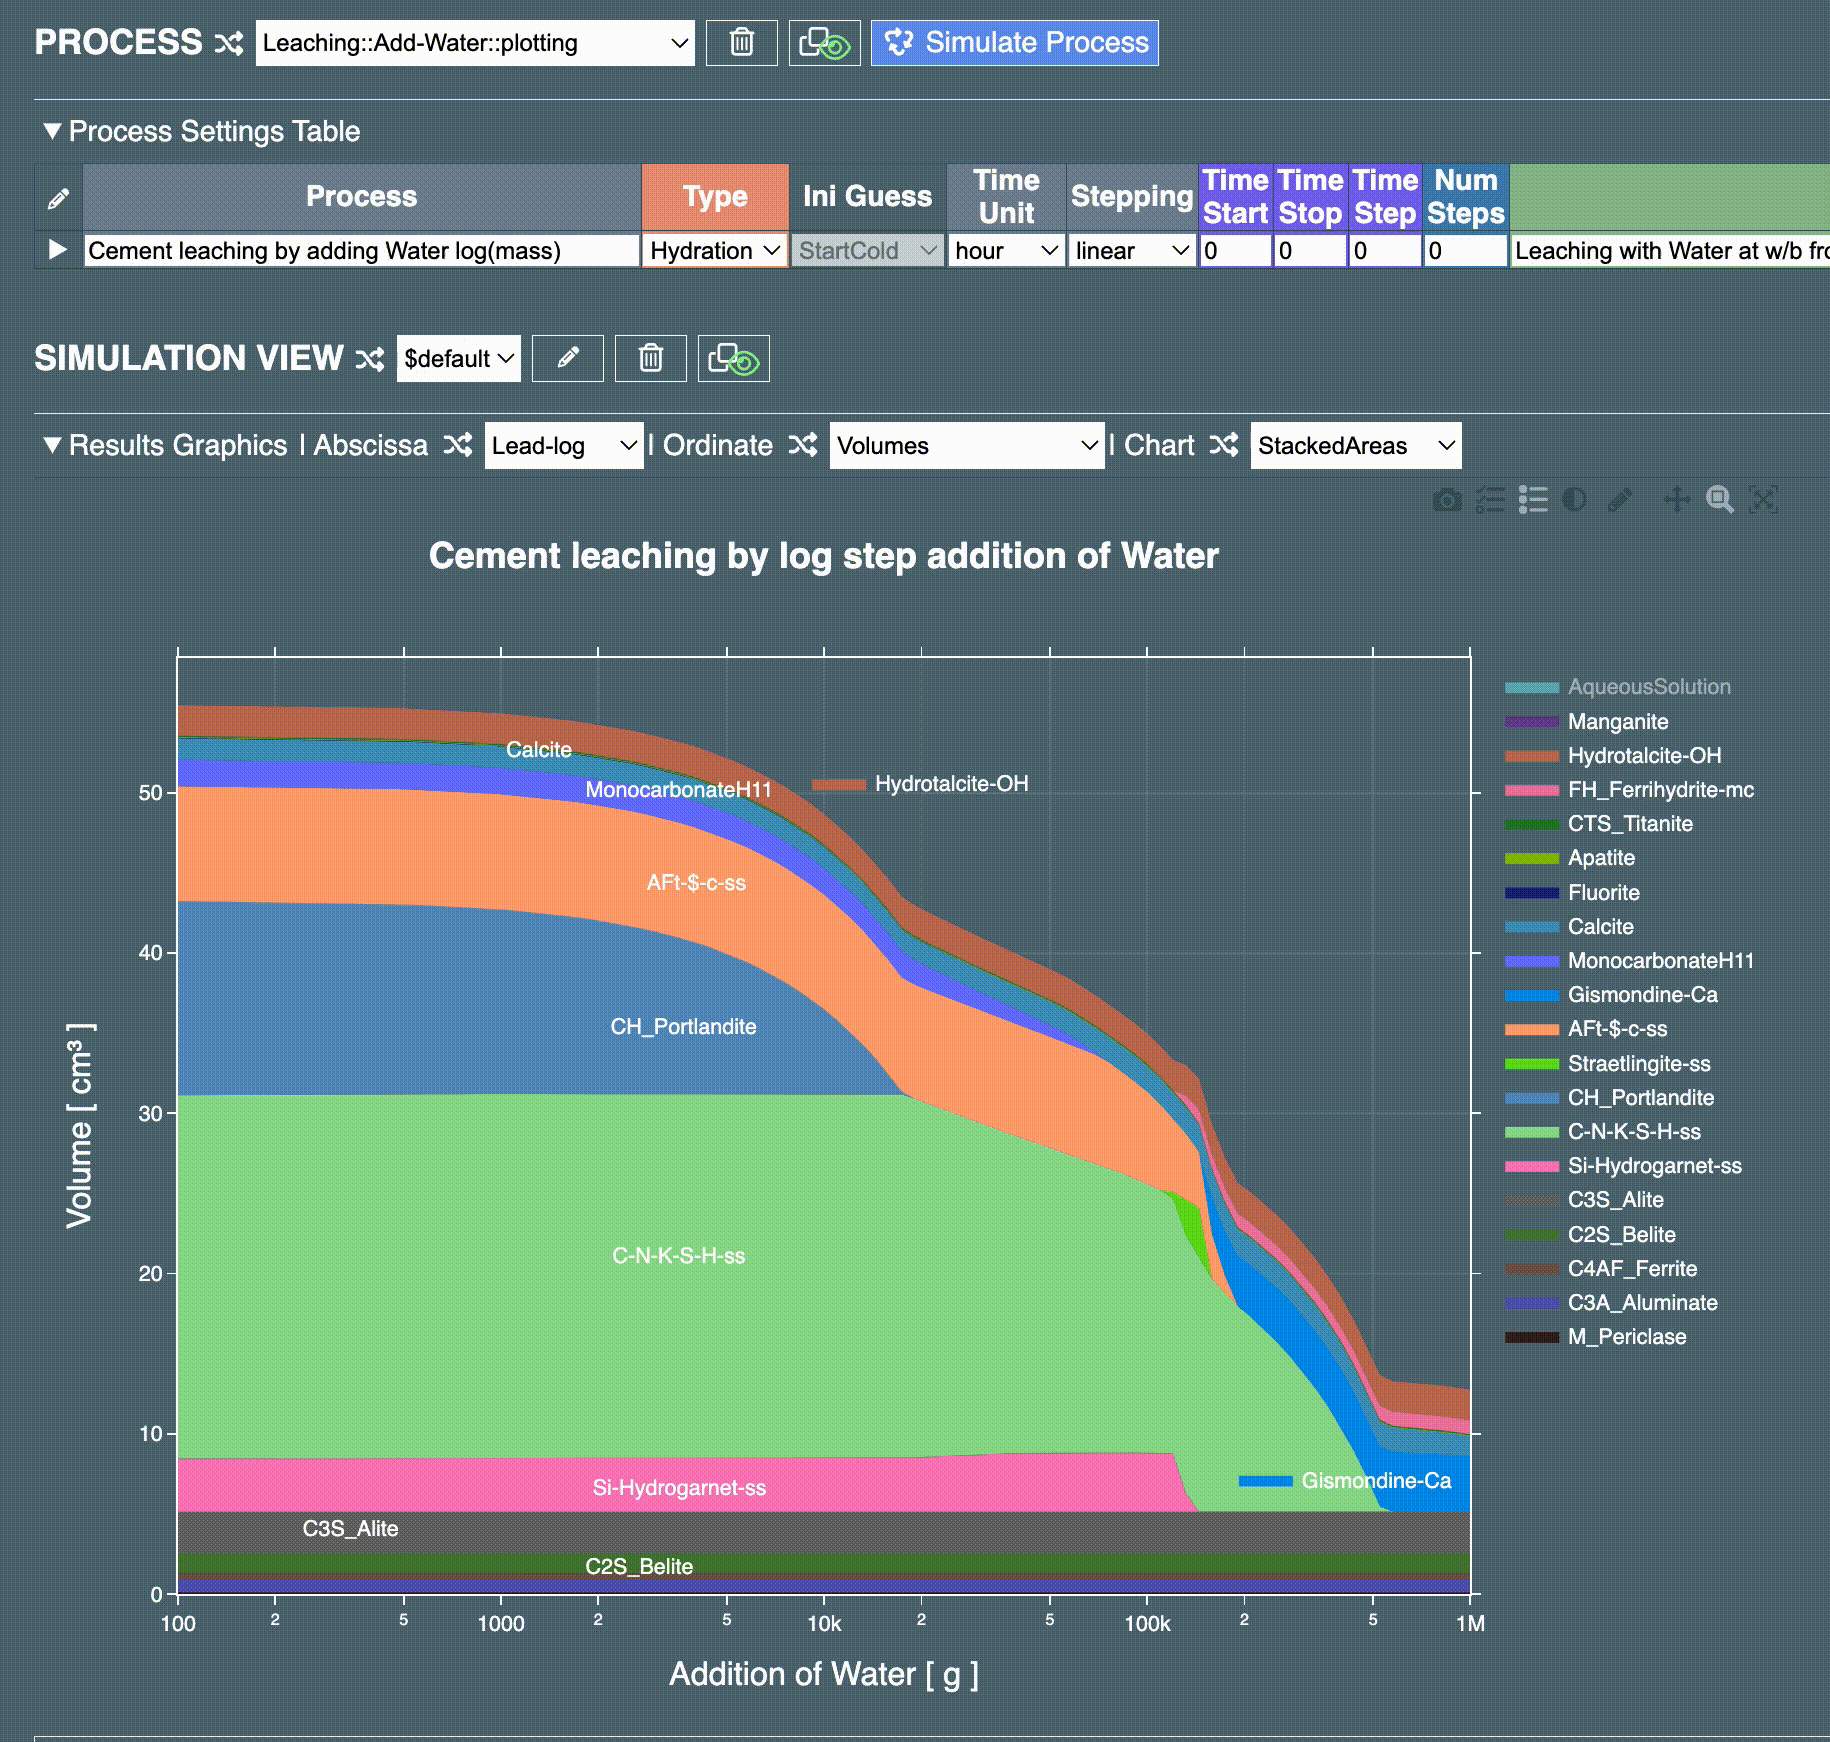
2-D plots of process simulation results
These plots appear after a process simulation along with the respective data table. A small toolbar in the upper-right corner of the plot allows various customizations of the image, legend items, plot and axis titles, and downloads of the image into local files in bitmap and vector formats. Most of this functionality is briefly showcased in four short screencasts below.
Attention!
Any edited plot will retain its customizations until the Process is re-calculated by clicking the "Simulate Process" button (which will reset all plots to default settings). If you want to retain plot customizations after the process recalculation then first clone the process and do not recalculate the original or the cloned one hereafter. This limitation may be removed in future versions of CemGEMS.
Screen cast 1: Basic navigation on a 2-D plot
 To re-run the screencast, please reload this page.
As an example, the simulation of cement leaching by stepwise addition of (large quantities of) water and plotting volumes or masses of phases initially results in a plot with only the aqueous solution area visible. It is trivially easy to display volume or mass changes of equilibrated minerals after clicking on a main legend entry "AqueousSolution" to disable showing the line/field for this phase.
In a zoom (default) mode, dragging the mouse cursor in any direction or making a rectangle allows to display a desired fragment of the plot to better see small details. After clicking on a 'Pan' toolbar button, you can explore the plot by mouse-draging it in any direction. Clicking on 'Zoom' button returns to the default mode (please, do not forget); the 'Autoscale' button resets the initial scales on both X and Y axes to see the whole image.
Clicking on the "Toggle light mode" button toggles the color scheme of the plot to a white ('light' mode) or a dark background ('dark' mode).
Screen cast 2: Editing plot- and axis titles in 'quick edit' mode
 To re-run the screen cast, please reload this page.
Editing (easier in 'light' mode) is activated by a "Toggle quick edit" toolbar button. All editable strings become highlighted in green font and can be edited upon clicking on them (this only changes the plot but not the underlying CemGEMS recipe and process documents). Edit the plot title and X, Y axis titles as desired. The legend texts can also be edited.
In the quick edit mode, the main legend is split into individual legend labels, initially located inside the plot on the left-hand side. Each label can be dragged (using the mouse cursor) to the desired location on the plot. After leaving the quick edit mode, only activated labels remain visible (initially by default, all labels are not activated). Activate the label by Clicking on its color element (the next click deactivates the label).
Screen cast 3: Moving and activating menu labels inside the plot in 'quick edit' mode
 To re-run the screen cast, please reload this page.
This screencast shows the changes between 'dark' and 'light' mode, then how to toggle the main legend visibility. Next, in the quick edit mode, it shows a typical way of activating relevant legend labels and distributing them over the stacked area plot for making it easier to read. This can also be done on a zoomed fragment, if needed. After leaving the quick edit mode, all activated labels remain visible in both light and dark modes (and will be exported so into image files).
Screen cast 4: Downloading plot images to local vector, bitmap or png graphic files
 To re-run the screen cast, please reload this page.
This screencast shows how to download the (customized) plot into a local file of five different formats. The export occurs as seen (i.e. in current light or dark mode); the quick edit mode should be deactivated. Only in PDF file export, the plot image is put on a white background, other three graphic formats have no background color. SVG and WEBP are vector graphics, readable by most modern web browsers and advanced graphic and text editors. The export occurs automatically into 'Downloads' folder of your user (home) directory. Example downloaded images are shown below.
Examples of downloaded plot image files
Plot in 'light' mode saved as a PNG bitmap file: 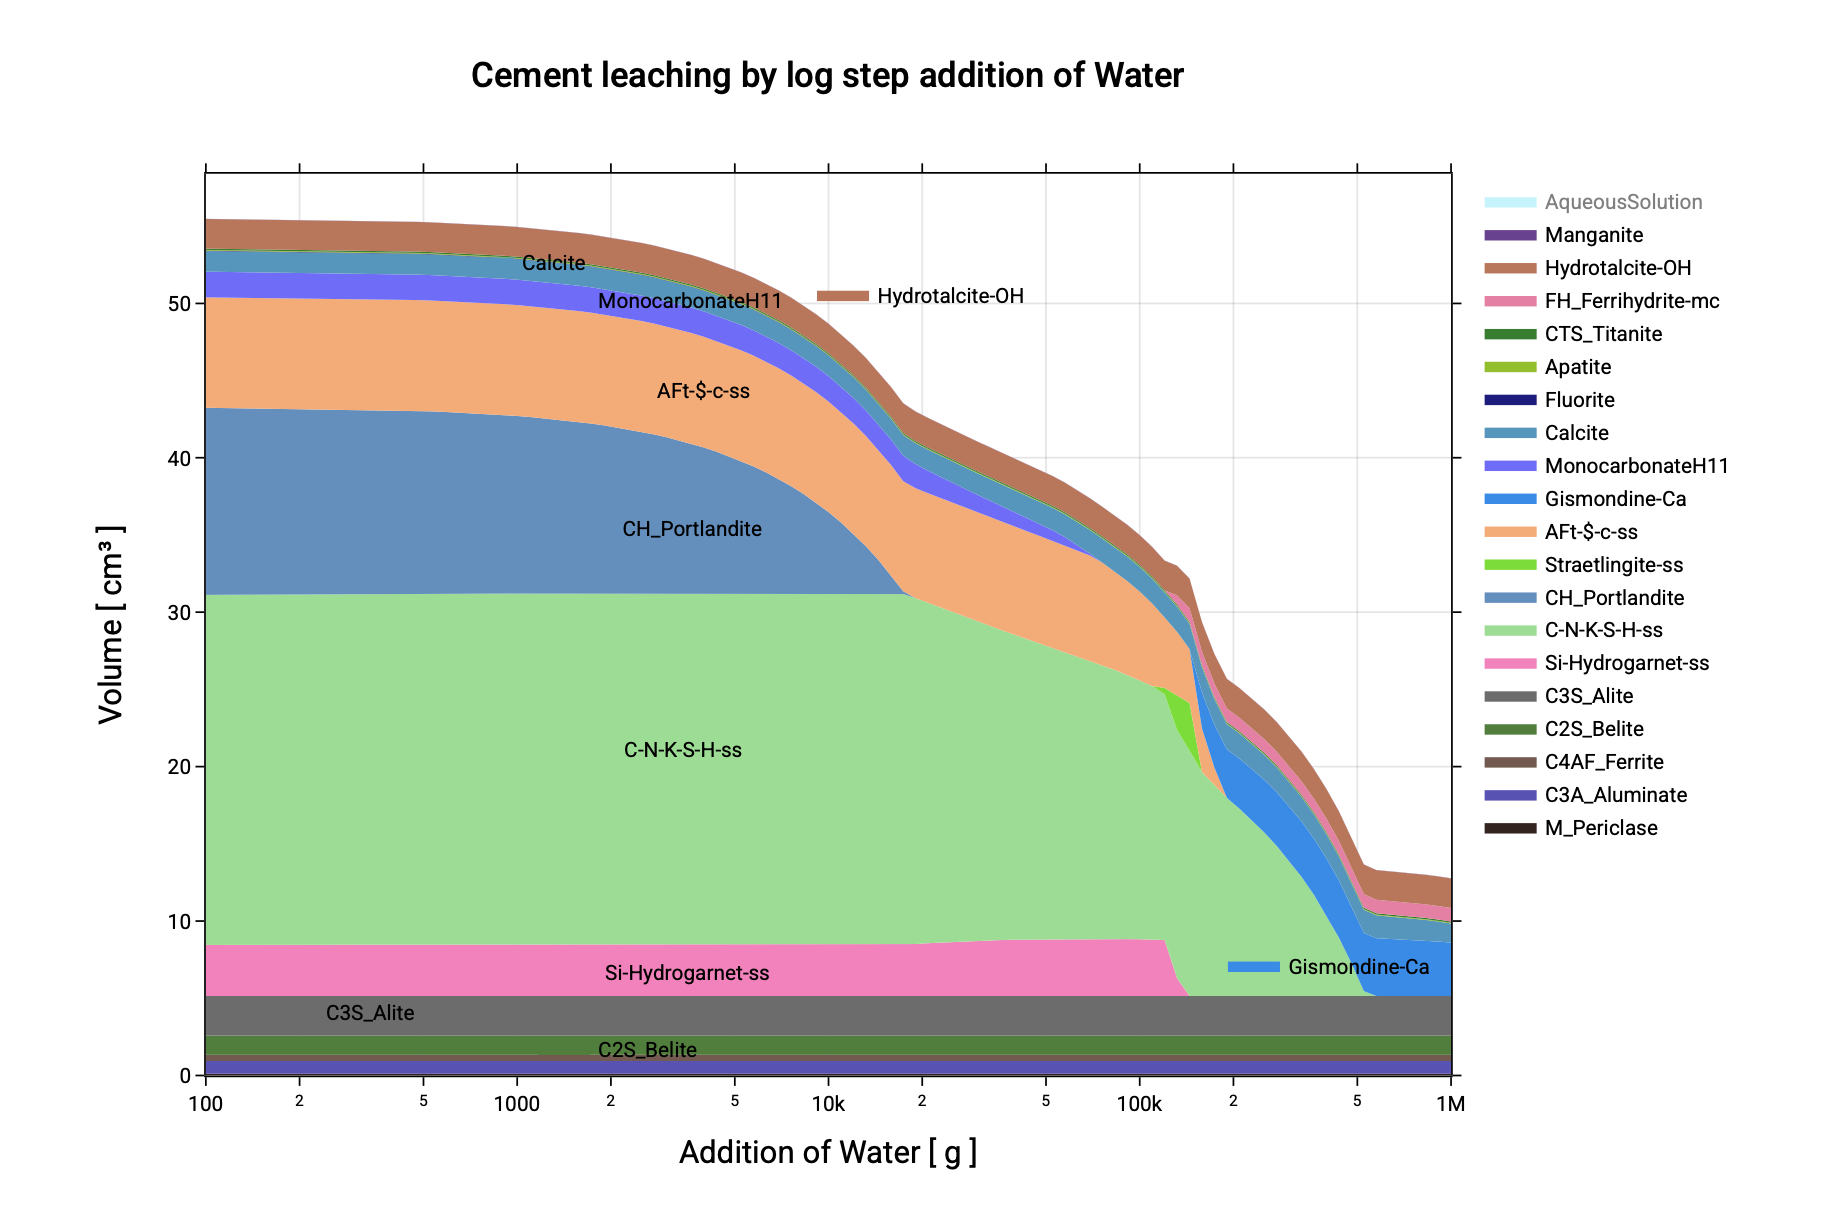 Obtained as a screenshot from a downloaded PDF file with white background mode.
Plot in 'light' mode saved as a SVG vector-graphics file:  To see the plot better, please toggle this web site to 'light' mode.
Plot in 'light' mode saved as a WEBP web-graphics file: 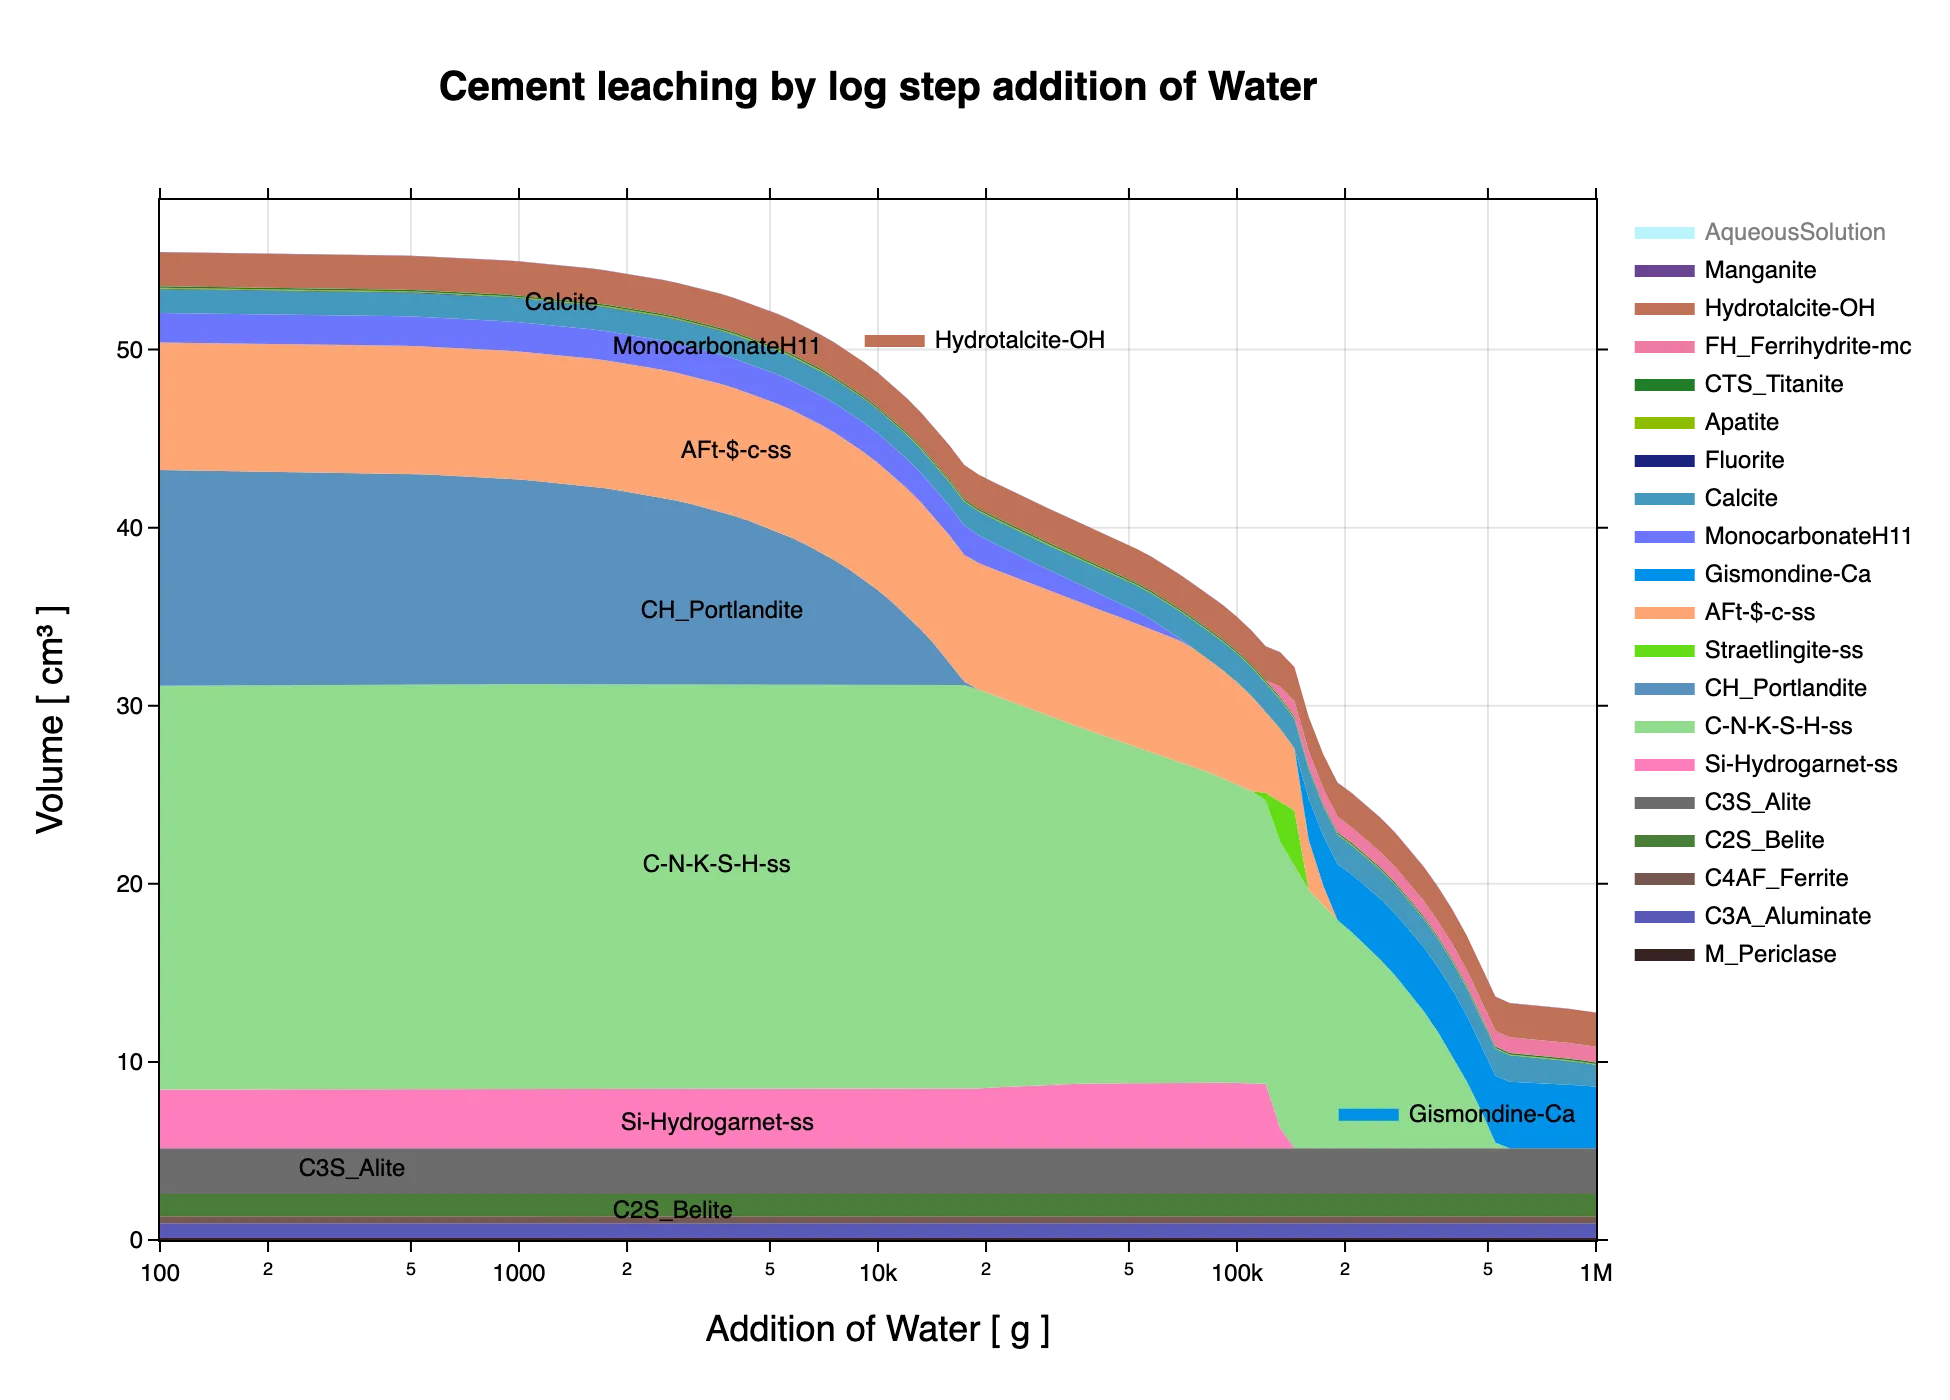 To see the plot better, please toggle this web site to 'light' mode.
Plot in 'dark' mode saved as a PNG butmap file (with no background): 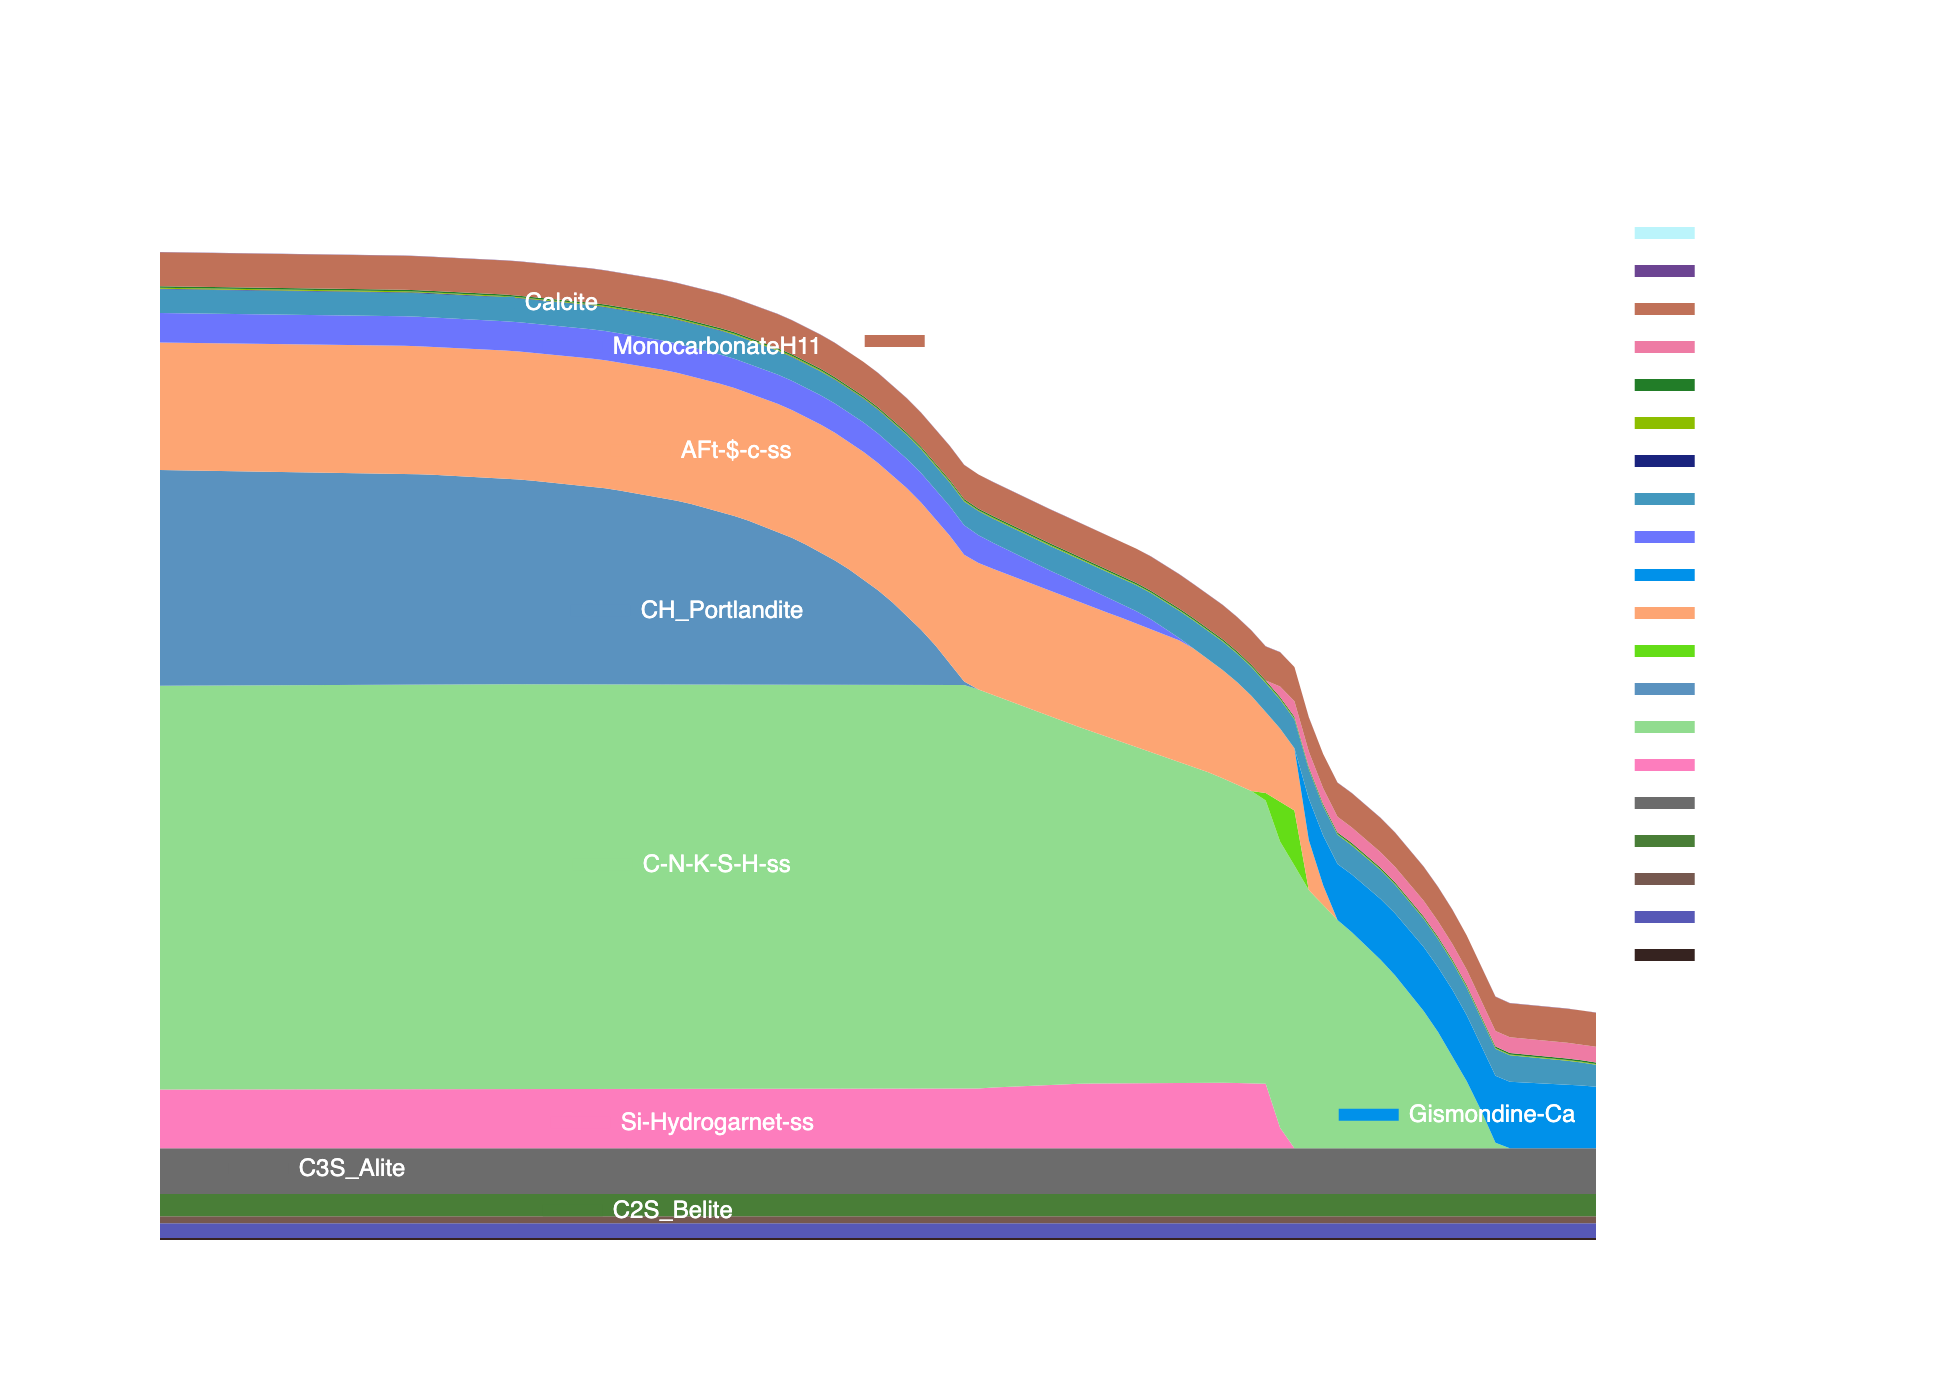 To see the plot better, please toggle this web site to 'dark' mode.
TBD
Plot template JSON document (in revision, TBD)
In order to facilitate sampling and plotting of process simulation results, CemGEMS web app provides a plot template compatible with all provided process templates and recipe templates. The new plot document is automatically created from a "$default" Plot template, also saved under a "$default" name in conjunction with the parent process.
The plot document contains tables with all abscissa and ordinate data collected from step recipes generated by the parent process. When the Plot definition is created, another template is automatically inserted as the "dataLegends" section, where the order of constituents, phases etc. in the table output is defined, and legend colors for plots of these are set. These settings can be edited by an expert user with help of the jsoneditor (which also has a color adjustment widget), if necessary. The plot definition document can also be cloned under a different name and modified further, if needed.
Any plot-table definition can be adjusted/modified by the (expert) user, as described in the redefining-plots page.
TBD