CemGEMS user guide
Redefining plots (in revision, TBD)
The new plot document is automatically created from a "$default" plot template upon a successfully finished simlation of a new process. The plot template contains the title and all legends and settings that can be used upon the choices of abscissa, ordinate and chart type. After the plot document was created (as a child to process), the simulation results are automatically sampled from all generated step recipes for all included abscissas and ordinates into arrays that are added to the plot document and saved to the client (and eventually to back-end user profile) database. Then the plot frame(s) are rendered in the web app page according to current selections (and re-rendered after one of them was changed). If the parent process simulation has been recalculated then the arrays for abscissas and ordinates are re-sampled, and plot frames are re-rendered.
A plot definition is a JSON document that contains many settings that define what and how will be plotted graphically or exported as data tables. In case if some adjustments are needed, the plot document can be cloned under a different name and edited by the expert user in the jsoneditor widget.
Cloning and editing plot documents
A useful modification of the plot document may consist in changing the title or adjusting the default colors (of lines or areas) for some ordinates (e.g. residual constituents, equilibrated phases, chemical elements). To excercise this, let us go back to the simplest getting-started workflow and create there the process of "Ingress" type with name "carbonation", which results in the plot frame similar to that shown in the screen images gallery.
Suppose we are going to edit the plot title by replacing words "CO2 or salt ingress" with "Carbonation"; then change the legend color of clinker constituent "Ferrite" (C4AF) to almost black; color of equilibrated solid phase "Ettringite-AlFe" to magenta; and color of "Sr" (chemical element) to pale-gray. To do all that, we first clone the "$default" plot document into another one (but for the same parent process). To do so, click on the "Clone" button (one with squares and a green eye) in the "Plot ..." row and type "augmented" as a new name, then click "Clone" button.
To edit the current plot document, click on the "pencil" button next to the plot name in the "Plot..." row. The jsoneditor widget appears with various sections that can be explored by expanding/collapsing upon clicking the triangles.
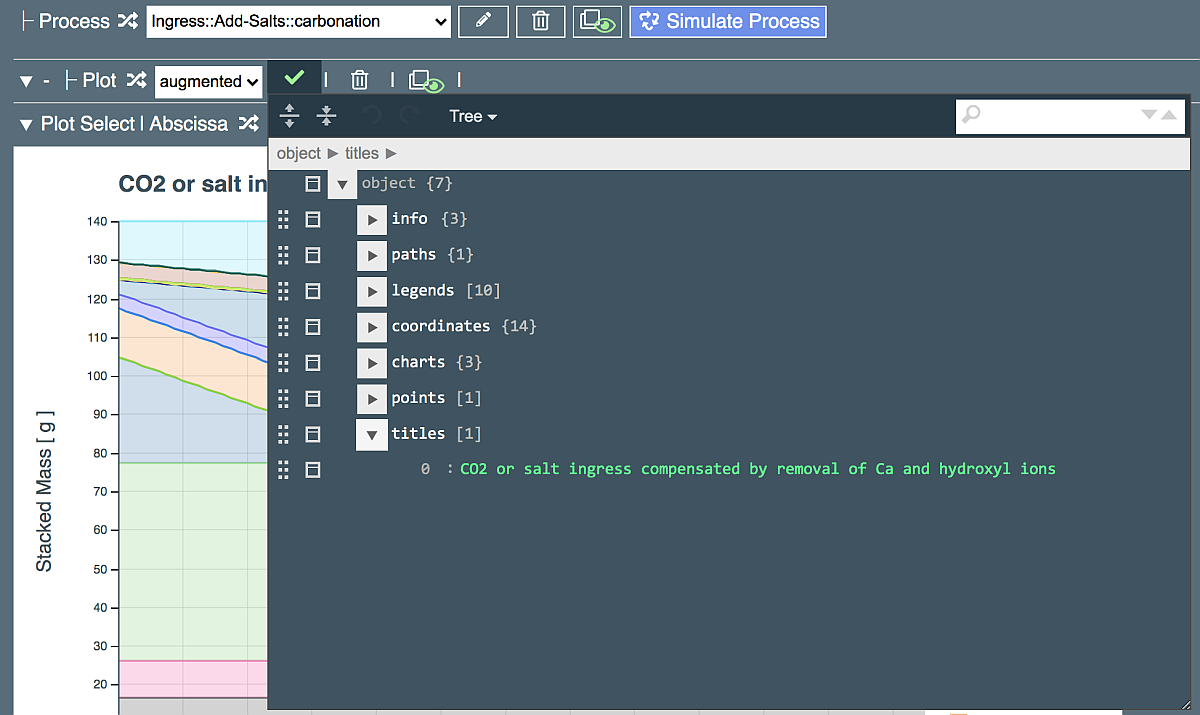
Changing the plot title
Click the triangle near "titles" entry to expand it, as shown above. Edit the title by replacing words "CO2 or salt ingress" with "Carbonation" and click on the green tick in left-upper area to close the jsoneditor. The graph will be redrawn to show the new title.
Editing colors in the plot legend
Open the plot definition in jsoneditor again. Legends used in rendering plot frames are located in the "legends" JSON array (list), which contains 9 elements. Expand these one-by-one to find "Constituent", which is also a list, and expand its elements one-by-one until "Ferrite" (as shown below). Alternatively, type "Ferrite" in the search field in the upper-right corner and press Enter.
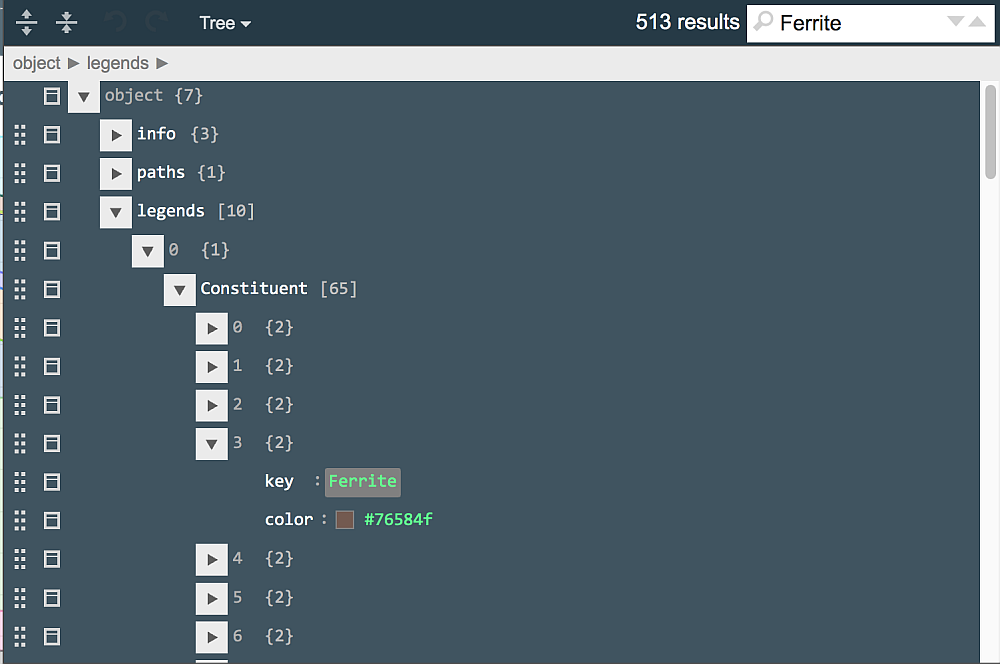
Each entry of the legend contains the name of respective object in the step recipe document, and the color shown as a small square sample and a numerical code. Luckily, jsoneditor allows to choose colors from a palette that appears upon clicking on the square sample:
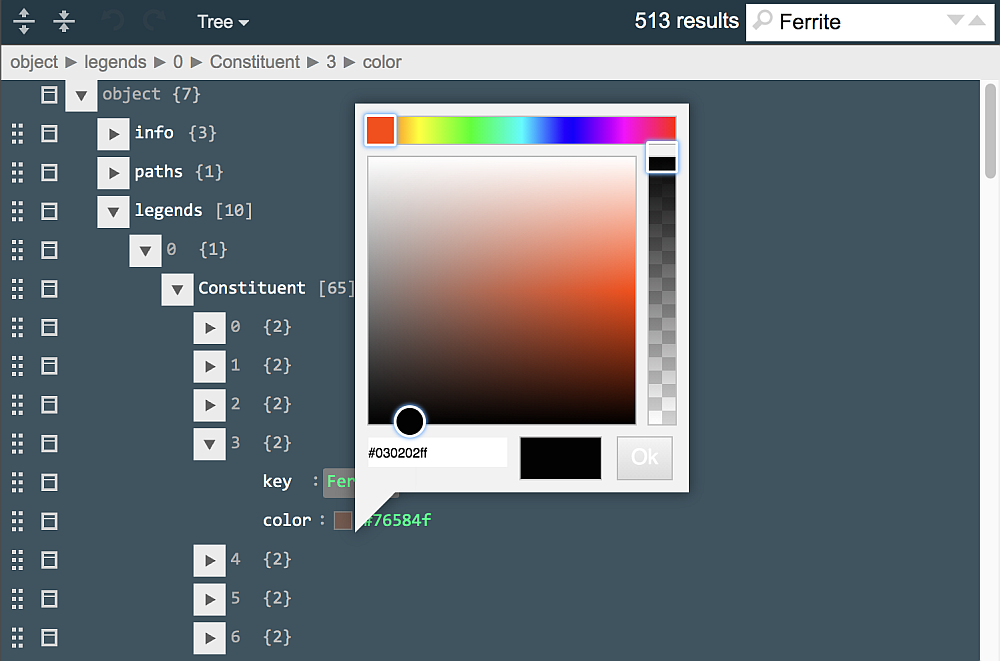
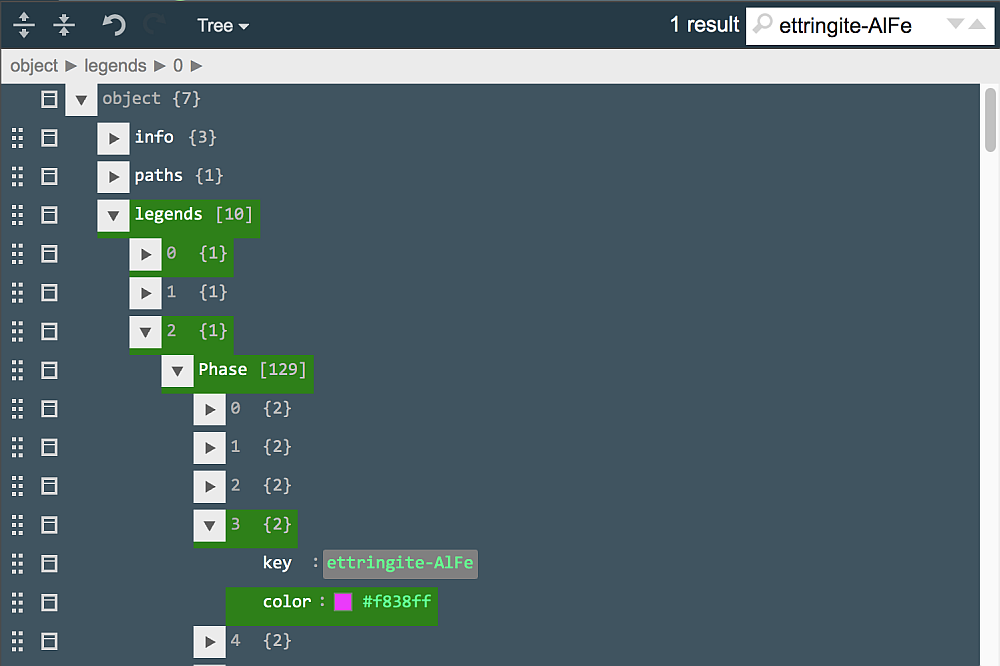
Move the color indicator around (as shown) and click "Ok" to choose a new color (code)for Ferrite constituent. Next, type "ettringite-AlFe" in the search field to locate this entry in "Phase" legend. Click on the color sample (light-green square) and, in the appearing palette, change the color to magenta.
Now, type "Sr" in the search field and, perhaps after several "next" clicks, find a "name": "Sr" entry in the "el" legend (legend #4). Click on the magenta square color and change it in the palette to pale-gray (code #c2c2c2 or close to it). Click on the green tick button in the "Plot..." row to close jsoneditor and introduce changes to the "augmented" plot document.
To make legend changes visible on the plot frames, the results need to be resampled (this also refers to changed phaseAliases in the parent recipe). To do this, click the "Simulate Process" button to re-run and re-sample the process. When the plot frame appears again, explore the different combinations of Ordinate and Chart to see the changed legend colors in effect. Upon re-simulation, the plot title can be reset to default; if needed, you can edit the title again (for instance, for making a screen image).
Changing path to data sampling in Ordinate
In CemGEMS, extraction of results into abscissa and ordinate arrays of the Plot document is not hardcoded, but described in the "coordinates" section of this document, which is combined of the available templates. This gives the expert user an opportunity to modify what data need to be extracted and how they should be checked in this operation. We can take a look on how this works by creating a process of "CEM-I-PC::min" recipe hydration using "Hydration-PK::time-log" process. When plotting ReactExtents, we notice that the reaction degree of Limestone (SCM) makes a horizontal line at 0.5. The question is - how this unnecessary line can be removed from the plot?
Let us, for example, take a look at how the sampling of volumes of residual constituents and equilibrated phases is defined. To do that, open the plot document in jsoneditor (click on the "pencil" button next to the plot name in the "Plot..." row), and type "Volume," in the search field. This should bring you to the "Volumes" ordinate definition. The sampling of data is described in the "dataset" subdocument, where the first of three entries look like (partially expanded):
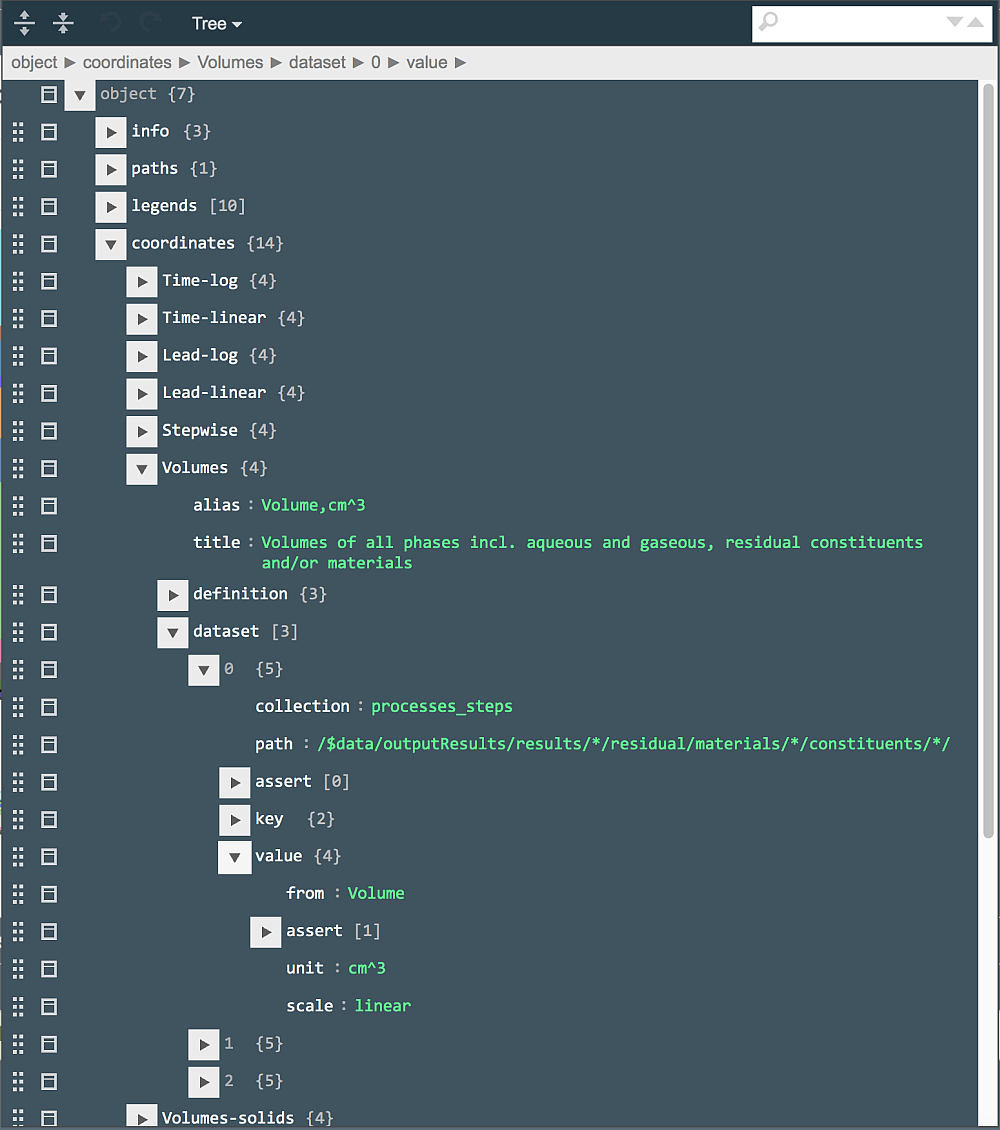
Basically, this tells the web app to read all documents (generated by the parent process) from the "processes_steps" database and, in each document, look in all materials and all their constituents available in the residual part of the results (of recipe partial equilibration) for the "Volume" keyword and take its value in cm^3. This is done by applying the JSON path visible in the "path" field:
/$data/outputResults/results/*/residual/materials/*/constituents/*/
The "assert" field under "value", if expanded, shows that only data for objects with Volume > 1e-6 cm^3 should be sampled. This is to avoid collecting volumes of constituents and phases that will not be visible on plots and will not make any significant contribution to total volume of cement.
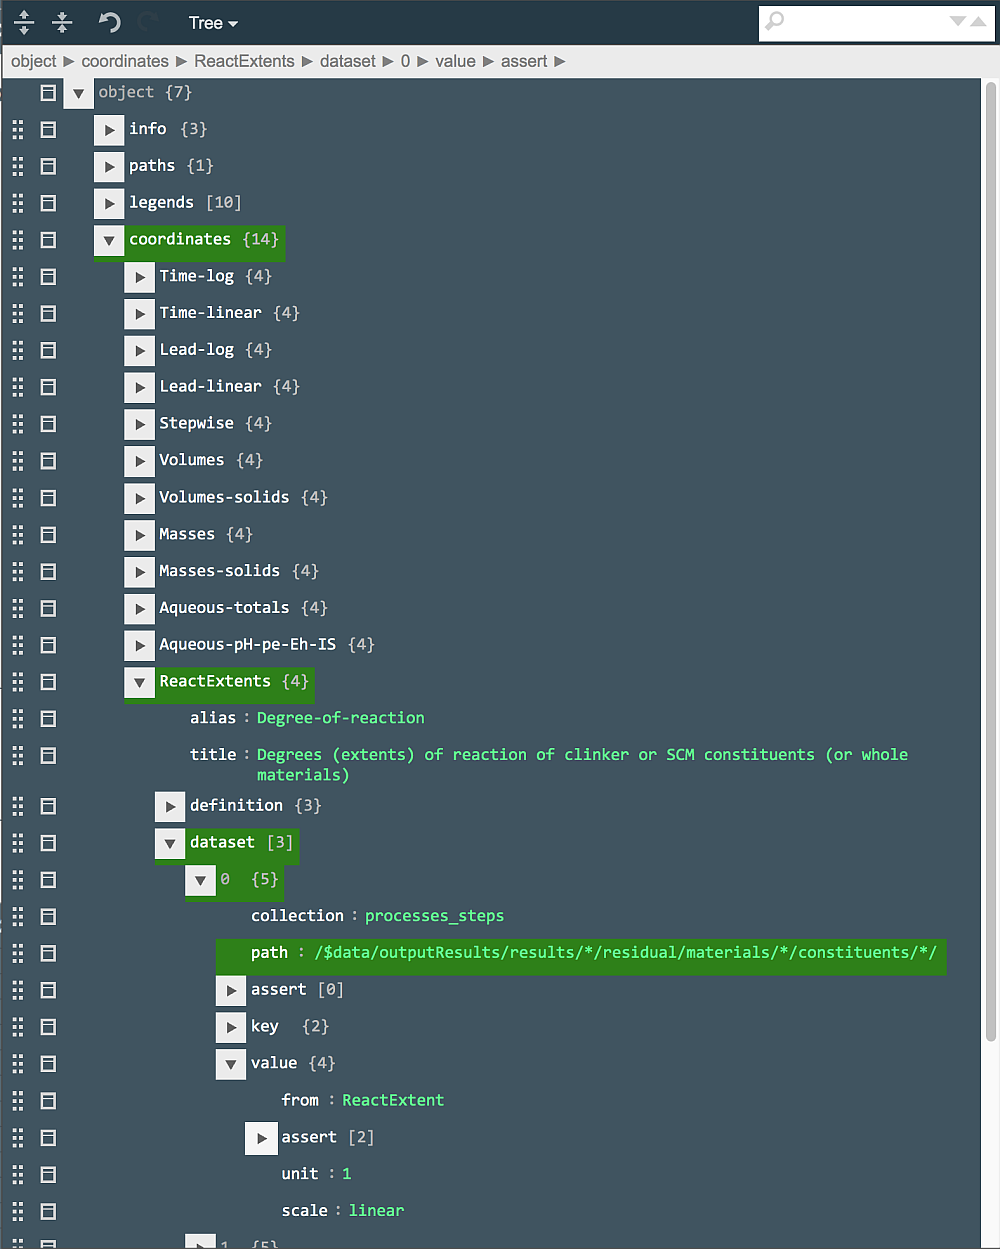
Now, let us look how the values of reaction extents (degree of reaction) of clinker constituents are collected. For that, type "extents" in the search field and press Enter. This will bring you to "ReactExtents" ordinate section, which (in partially expanded form) shows the following "path" in the "dataset" #0 entry:
/$data/inputRecipes/recipes/*/materials/*/constituents/*/
By comparing this path with the path for Volume, an obvious difference is that the ReactExtent values are collected not from the results part of the recipe, but from the input part. This has a drawback that values for constituents with zero amounts in the results will also be sampled (as this is the case for Limestone SCM that makes a horisontal line in the plot frame for ReactExtents). However, looking into the tree-like table of the parent recipe (Residual part), it is easy to see that ReactExtent values are also available there just where the Volume or Density values are available. This means that all we need to do is to replace the present "path" string with
/$data/outputResults/results/*/residual/materials/*/constituents/*/
i.e. exactly the same one as that we have seen for the Volumes ordinate:
What remains to do is to save the edited plot document (by clicking on the green tick in the "Plot..." row), and re-simulate the process. When the frame is re-plotted (with ReactExtents as ordinate), the curves for Alite, Belite, Ferrite and Aluminate are there, but the line for Limestone has disappeared because this constituent of SCM material is not present in the residual part of any step recipe.
TBD: More improvements of plots are likely to be added in future.